
RAINFALL
The average annual rainfall in the non-tidal catchment area of 9948 square kilometres (3845 square miles), ranges from 740 mm (29 inches) in the upper Thames to 625 mm (25 inches) in the lower Thames. The average daily rainfall equates to about 19,800 million litres/day (4,350 million gallons/day). More than half this rainfall, about 13,300 million litres/day (2,920 million gallons/day), is lost to evaporation or taken up by plant growth (evapo-transpiration losses). The remainder, 6,500 million litres/day (1,430 million gallons/day), provides the water resource that has to be shared between river flows, to support the natural environment, and the community needs for water supplies to homes, commerce, industry and agriculture and is known as the 'Natural Flow' or 'Residual Rainfall'.
The Thames itself, from Lechlade to Teddington, at 'bank-full' conditions, holds about 20,500 million litres (4,500 million gallons), so it only holds about as much water as falls on the catchment area in one day.
The residual rainfall (rainfall after evapo-transpiration losses) eventually emerges into the River. It may do this by direct run-off over the land into ditches, streams and tributaries or through storm water drains. On the other hand it may percolate downwards through the subsoil to an underground water table from which it eventually emerges via springs that are a common feature where an underground water table exists. Which of these courses it follows depends on the geology of the area.
In impervious areas, such as London and Oxford clays, no downward percolation is possible so all residual rainfall rapidly runs off to feed local watercourses. Watercourses that drain such areas present 'flashy' characteristics: they rise rapidly after rainfall but flows are not maintained unless replenised by more rainfall and the flows soon turn off in times of drought.
In contrast, in pervious strata, such as the chalk and limestone hills, the emergence of residual rainfall into the River is a much more gradual process. When the residual rainfall is high, as it is in the winter when evapo-transpiration losses are low, it percolates down to the underground water table faster than the springs discharge it. This cause the water table to rise and a store of water is built up.
During the summer this store of water is available to maintain the spring-fed flows (which are the principal contributors to the summer flow of the Thames) and consequently the River can maintain its flow far into the summer.
The 'flashy' watercourse of the impervious areas are the principal contributors to the high winter flows that can lead to floods.
Fortunately, more than half the catchment area of the non-tidal Thames consists of pervious water bearing rocks: were it not so then we would have to endure both drought and flood conditions of much greater severity than we do at present.
FLOODING
The earliest recorded flood on the River Thames was in AD 9. Some 29 years later another flood extended over 4 counties when it is said that 10,000 people were drowned. Since then a number of floods have occurred many of which have been recorded. In 1774, which was the greatest flood for a century, Henley Bridge was washed away. At Mapledurham, it is estimated that the flood level in 1774 was at least 600mm (2 feet) above the level recorded in 1894. There were also significant floods in 1848, 1852 and 1875.
One of the worst floods on the non-tidal Thames in recent history, occurred in 1894 and was due to exceptionally heavy rainfall - during the 26 days prior to its peak, over 200 mm (8 inches) of rain fell which was equal to one third of the total annual rainfall for the area. To give some idea of the height of the floodwater, the following heights of water above normal summer levels were recorded (in each case above the head of the lock):
Lock |
Height above head of lock |
|---|---|
Marlow |
1.75m(5'9") |
Cookham |
1.78m(5'10") |
Bray |
2.50m(8'3") |
Old Windsor |
2.44m(8'0") |
Boulters |
1.60m(5'3") |
Molesey |
2.60m(8'6") |
These 1894 levels are recorded on plaques at many of the locks along the Thames.
This Flood of 1894 reached its peak on 17th November. The two floods prior to this occurred in 1875 and 1852. The 1875 flood occurred between the 10th and 17th November , and yes, the flood of 1852 also happened on 17th November - an uncanny coincidence.
In recent memory, snow, storms and rain combined to cause widespread flooding in March 1947 - the worst since 1894. The River below Chertsey was 3 miles wide and Wraysbury, Datchet and Runnymede were isolated. In Reading a thousand people had to leave their homes and in Maidenhead the floods were over 1.8m (6 feet) deep. Ironically, later that year there was a severe drought with rainfall of only 58mm (2.29 inches) for the three months ending on 31 October.
 |
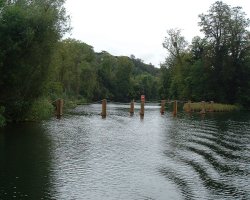
Flooding at Goring - January 2003 |
In December 2002, the Thames catchment experienced more than twice the seasonal average rainfall and the river reached very high levels. More than 50mm (2 inches) of rain fell in the period between Christmas Eve and New Year's Day when the River was already full. This caused extensive flooding in the Thames basin during the first week of January 2003 which was the worst since 1947. Some 550 houses were flooded. At Mapledurham Lock the water was only 300mm (12 inches) lower than in 1947 and 600mm (2 feet) lower than in 1894.
 |
Entrance to the Jubilee River |
The area around Maidenhead is prone to flooding and consequently the largest river flood alleviation scheme in the UK - The Maidenhead, Eton and Windsor Flood Alleviation Scheme - was started in 1996 and became operational in 2002. Its 11.5km (7¼ mile) flood relief channel has been designed to resemble a natural river and will hopefully attract wildlife back to the area that has been lost to development along the Thames. It has been named 'Jubilee River' and will protect 12,500 people and some 5000 properties.
On 31 January 1953, the combination of a north westerly gale, a very deep area of low pressure, a high spring tide and the topography of the North Sea (which gets narrower and shallower in the south) caused a massive storm surge - the piling up of water at the southern end of the North Sea. As a result, the sea level rose nearly nine feet above normal high spring tide levels causing exceptional flooding along the East Coast and Thames Estuary, during which 307 people died, 24,000 homes were damaged or destroyed and 46,000 head of livestock were lost. The whole of Canvey Island, on the Thames Estuary, was submerged and the population of 11,000 people had to be evacuted but this flooding claimed 58 lives on this Island alone. This disaster prompted the construction of the Thames Barrier at Woolwich at a cost of around £535 million. It became operational in October 1982 and it was officially opened by Her Majesty The Queen on 9 May 1984.
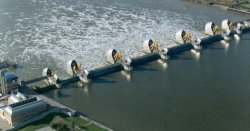 |
The Thames Barrier |
Since it became operational in 1982 and up to the end of 2004, the Thames Barrier has been closed on 88 occasions to protect London from flooding (54 times against surge tides and 34 times to stop high tides meeting heavy rainfall) but in the 6 month period from November 2000 to March 2001 the emergency closures happened 23 times.
During the extensive flooding in the first week of January 2003, the Barrier was closed on 13 consecutive tides - a record breaking sequence, preventing the flooding of a number of properties at the top end of the tidal reach.
Nearly all these closures were the result of a combination of factors including high spring tides, depressions in the North Sea, wind effects in the English Channel and high River flows.
The Thames Barrier is only one part of London's flood defences. There are 36 other smaller barriers and gates and over 115 miles of defence walls and embankments along the banks of the River. But the Environment Agency has already embarked on a long term project, Thames Estuary 2100 (TE2100), to extend its flood defence plans for the Thames Estuary to 100 years, accommodating a new generation of Thames defences to be built between 2015 and 2040.
Flood Warning Information for the River Thames (or in fact any other river or area) can be obtained by telephoning the Environment Agency's FLOODLINE number on 0845 988 1188 or by checking their webpage. For a direct link to the flood warning page at the Environment Agency, Click Here
The symbols used on the webpage are as follows and have the meanings indicated:
Be Aware! |
Flooding of homes, businesses and main roads is expected. |
Severe flooding is expected. |
Issued when flood watches and warnings are no longer in place. |
FROSTS
One of the earliest recorded incidents of the freezing of the tidal River Thames was in AD 250 when it froze for 9 weeks. This was surpassed in the winter of 1715-16 when it froze over for 13 weeks but the record stands at 14 weeks during 1410.
In the 17th and 18th centuries, frost fairs were held in London whenever the River froze. The most significant ones were in 1683-84, 1715-16 and 1739-40 with the last one taking place in 1813-14. During the frost in the winter of 1683-84, the ice was so thick that it was strong enough to support horse-drawn carts. The removal of the old London Bridge (which had the effect of a dam) and the building of the Embankments in the 19th century (which narrowed the River), caused the flow to be increased to such an extent that it was no longer possible for the tidal Thames to freeze over.
In 1963, almost the whole of the Non-tidal Thames froze as far as Teddington an event that had not happened since 1895 when a carnival was held on the ice in Oxford at which an ox was roasted. During the frost of 1891 when the river froze over in Oxford, the ice was so thick that it was possible for a coach and four horses to drive across it.
HEAT-WAVE
There were four major glacial periods when there were long spells of intense cold. Between these periods the climatic conditions improved and temperatures rose - called 'interglacials'. During one of these, the temperature rose to such an extent that the climate in the Thames Valley was similar to that in Central Africa today.
The actions of the tides (the rise (flood) and fall (ebb) of the water level) is one of the most significant differences between the River Thames above and below Teddington.
Twice a day the tide rises and falls. In the open sea the rise and fall are almost of equal duration but in the River the effect of friction on the river bed and its banks, alters this. In the Thames, the flood tide becomes progressively shorter and the ebb progressively longer, the further upstream you go. In other words, the upper reaches 'fill' quicker than they 'empty'. There is also a delay in the time of high water the further you move upstream.
Consequently, high tide at Richmond occurs about 1 hour after high tide at London Bridge but low water occurs between 3 and 3½ hours after low water at London Bridge.
The difference in the height of water at high and low tide (the tidal range) depends upon whether or not they are Spring (largest range) or Neap (smallest range) tides. At London Bridge, the Mean Range at Spring tides is 6.6m (21'7") whereas at Neap tides it is 4.6m (15'0").
Spring tides happen about every two weeks just after the Full and New Moon when the Sun and the Moon are pulling together. At Spring tides High Water is very high and Low Water is very low. Neap tides also occur about every two weeks but just after the Moon is in its first and last quarters when the Sun and the Moon are at right angles to each other.
It was reported in the 'Times' of 18 May 1948 that an exceptionally low tide had reduced the river at Richmond to a width of only 10 feet and a depth of 3ft 6 inches.
The other significant difference between water above and below Teddington is the amount of salt in the water (its salinity). Above Teddington the River contains fresh water whereas below Teddington the water is saline but the degree of salinity changes with the state of the tide and the volume of fresh water coming downstream. As fresh water is less dense than sea water, the fresh water forms a wedge and moves out to sea flowing over the denser sea water. The tidal salt water flows in a reverse direction below the fresh water.
However, as the tidal Thames is so irregular, with 25 sharp bends between Teddington and the sea, the fresh and sea waters become thoroughly mixed and at slack water there is little difference between the salinity of the water at the surface and that near the bed. The overall salt content does gradually increase towards the sea but it is an interesting fact that the tidal Thames is essentially fresh water as far downstream as Battersea.
The movement downstream of a discrete body of water in the Tidal Thames (known as the tidal excursion) is also affected by the tides and the volume of other water entering the Thames. Although there are a number of tributaries entering the tidal Thames, the most significant impact on the 'flushing' of the River is the flow over Teddington Weir. A body of water will move a considerable distance downstream on an ebb tide but may return most of the way back on the next flood tide. The average tidal excursion in the middle reaches of the river Thames is about 13 to 14 km (8 to 9 miles) but this net daily seaward movement in the Summer may be only 1 to 2 km (0.6 to 1.2 miles). Therefore the average time taken for water to pass from Teddington to the sea may vary between 3 weeks under high fresh water flows to more than 3 months during low flows.
Tidal velocities vary considerably in different parts of the River and are influenced by the volume of water flowing over Teddington weir and whether or not it is Spring or Neap tides. Under average or normal conditions, the rate above London Bridge may be between 1 and 3 knots (nautical miles per hour), but at times of very high flows over Teddington weir the rate may be as high as 7 knots. Below London Bridge and as far as Woolwich, the speed under average conditions is 2.3 knots on the ebb and 2 knots on the flood tide. At times of heavy flows over Teddington weir the ebb current may be increased and the flood current decreased by 1 knot. Between Woolwich and Gravesend, the ebb is usually 2 knots and the flood 1.3 knots but in all parts of the River below London Bridge velocities up to 3.5 knots may be encounted under abnormal conditions on ebb tides.
To see the PLA Tide Tables page relating to Walton-on-the-Naze, Margate, Southend, Coryton, Tilbury, North Woolwich and London Bridge Click Here
For tidal predictions for various locations on the River Thames (Albert Bridge, Hammersmith Bridge, Kew Bridge, London Bridge, Richmond Lock, Sheerness or Tilbury) issued by the UK Hydrograhic Office Click Here
To return to The River Thames page Click Here
Copyright © The Harts